Trend trader StrategyFirst I would like to thank to @JustUncleL since this strategy started from one of his scalper strategies
This strategy can be adapted to all time charts .
First it has the session where we want to trade, for this example I choosed the EURUSD so I only take in consideration london/neywork session.
Its made from 3 EMA :
normal
slow
ultra slow
It has has the capacity to use HA candles into consideration if its needed.
At the same time we have a price channel made from faster MAs, that act like a bollinger band .
Together with all of them, we establish which trend we have if its uptrend or downtrend
Then we check the candles if they are below or above the MA , and based on the condition if they crossed recently we can suggest if its a buy or a long condition
At the same time we have 2 options of stop conditions:
Through a trailing stop made from ATR or % based
And second, a SL/TP made from pip points or % based.
For this example I used % based.
Let me know what you think about it, and if you found some nice settings for it. So far I only adapted to EURUSD 1 min time.
Buscar en scripts para "Trailing stop"

[CP]ATR Triple Stop Loss LevelsATR based Triple Stop Loss levels that are plotted on the chart (like moving averages!).
With ATR Levels plotted on the price chart itself, you can better set your volatility based trailing Stop Loss.
Also helps to define the SL when making an entry into a stock.
Note:
This indicator is supposed to be used on Daily and Weekly Charts.
For other timeframes you would need to tweek the default parameters.

EMA 5/10/21 SMA 50/100/200The Script is mixture of both EMAs and SMAs. EMA 5/10/21 are powerful indicators for short term providing more weightage to the recent prices. SMA 50/100/200 provide the long term view.
5 Day EMA: This is a sign of strong momentum. It tracks the trend in the short term time frame. This is support in the strongest up trends. This line can only be used in low volatility trends with strong momentum. A break back above this line is a sign for me that an uptrend may be resuming. I primarily use it as an end of day trailing stop. It is rare that this line does not break intraday, even in the strongest trending markets.
• 10 day EMA: The 10 day EMA is a great moving average to use to keep you on the right side of the major market trend. It is usually the first line to be lost before any real trouble begins. It can be used as a standalone signal in some stocks and markets that tend to trend strongly in one direction for long periods.
• 21 day EMA: This is the intermediate term moving average. It is generally the last line of support in a volatile uptrend. To me, it is the inevitable reversion to the mean in a market when it finally pulls back after an extended trend.
• 50 day SMA: This is the line that strong leading stocks typically pull back to. This is usually the support level for strong uptrends. It is normal for uptrending markets to pull back to this line and find support. Most bull markets and uptrends will pull back to this level. It is generally a great “Buy the dip” level.
• 100 day SMA: This is the line that provides the support between the 50 day and the 200 day. If it does not hold as support, there is a high probability that the 200 day SMA is the next stop. This is the deeper pullback level in bull markets and uptrends. It usually presents a great risk/reward ratio in bull markets.
• 200 day SMA: Bulls like to buy dips when markets are trading above the 200 day moving average, while bears sell rallies short below it. Bears usually win below this line, as the 200 day becomes longer term resistance, and bulls buy pullbacks to the 200 day as long as the price stays above it. This line is one of the biggest signals in the market telling you which side to be on. Bull above, Bear below. Bad things happen to stocks and markets when this line is lost.

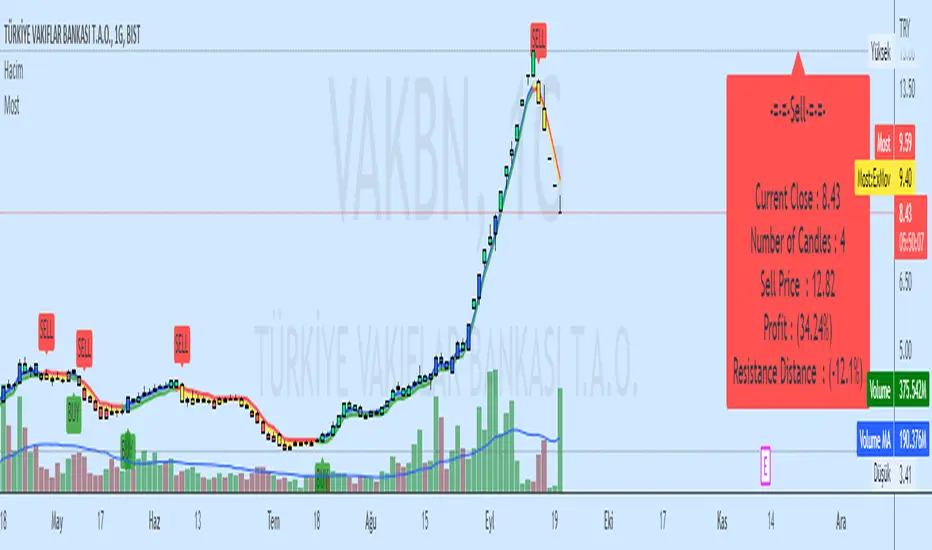
Moving Stop Loss (Most) by ceyhunATR is an indicator that has been removed and replaced with a moving average.Bar colors and infopanel have been added.
//Barcolor
Green = ExMov > Most and close > Most and low > Most
Blue = ExMov > Most and close > Most and low < Most
Red = Most > ExMov and close < Most and high < Most
Yellow = Most > ExMov and close < Most and high > Most
//It gives White color where there is deterioration.
//InfoPanel
Buy Price = Blue draws the circles at the purchase price.
Profit Long>20 = Risk level taken as a percentage, I got the highest 20%, you can determine as you wish.
Sell Price = Red draws the circles at the purchase price.
Profit Short>20 = Risk level taken as a percentage, I got the highest 20%, you can determine as you wish.
==Atr Original Code==
CDC ATR Trailing Stop V2.1 (2013)
==Most Code==
MOST by Anıl ÖZEKŞİ
Barcolor
Barcolor
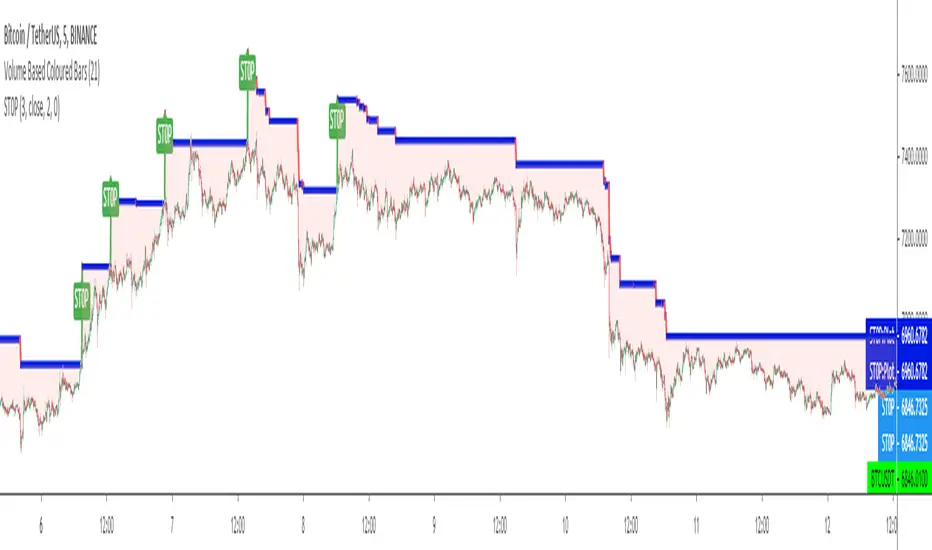
ST0PST0P is a kind of a TRAILING STOP LOSS INDICATOR in which users can set up LONG or SHORT trade versions and also can set up a STOP LOSS level by percent % or unit difference.
It tries to solve the problem of stop loss indicators' default BUY or SELL settings and non adjustable stop levels of % and difference change in price levels.
(Will try to make updates to add user defined start bars.)
Kıvanç Özbilgiç
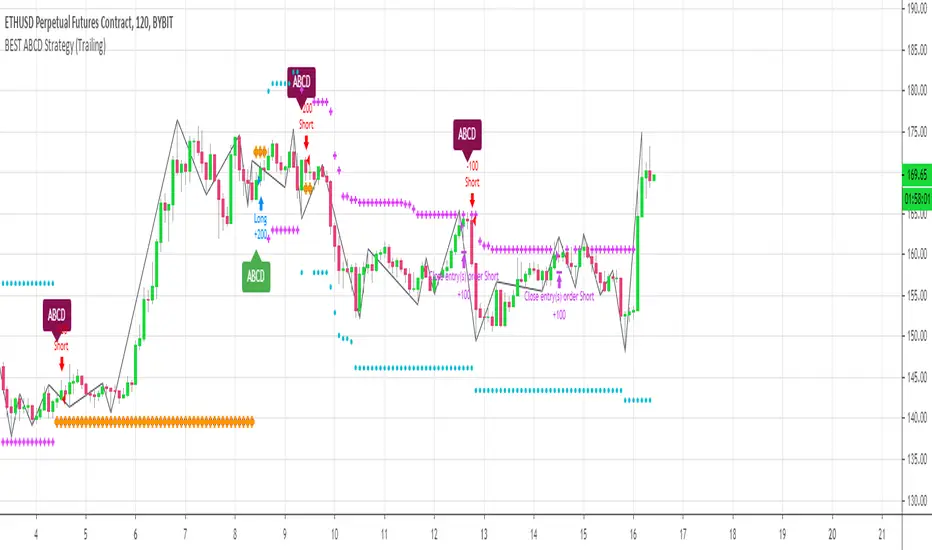
[Daveatt] BEST ABCD Pattern Strategy (Trailing SL + TP)Hello traders
This is the strategy version of my ABCD pattern. I added the Trailing Stop and Trailing Profit upon a follower request
I - Concept
I present to you, ladies and gentlemen, the first screener for harmonic patterns .
Starting with an ACBD pattern screener this time!!
I used the calculations from Ricardo Santo's script
In short, he's using fractals (regular or Bill Williams ) for the pattern calculations. A masterpiece !!!
II - Definitions
The ABCD pattern ( AB=CD ) is one of the classic chart patterns which is repeated over and over again.
The ABCD pattern shows perfect harmony between price and time.
The Williams Fractal is an indicator, developed by Bill Williams , that aims to detect reversal points (highs and lows) and marks them with arrows.
Up fractals and down fractals have specific shapes. The Williams Fractal indicator helps users determine in which direction price will develop
💎Strategy filters💎
I included some cool backtest filters:
- Trailing stop with trigger concept coming from this Trailing Stop Strategy
- Trailing profit with trigger coming from this Trailing Profit Strategy
Last words
It works for all asset classes (Forex, crypto, indices, etc...) and does not repaint
All the BEST
Dave
BEST ATR Stop Multiple StrategyHello traders
Here we go again.... with another strategy snippet.
Reminder: it's an alternative of this Trailing Stop strategy script
Entry logic
The entry is based on a Simple Moving Averages (SMA) cross.
This part doesn't matter here - as I wanted to focus on the ATR multiple stop loss component.
ATR STOP
This strategy snippet uses an entry stop loss defined based on a multiple of the average true range value.
The soure code detects ATR value at entry price, applies the multiplier and will set a static (= non trailing) stop-loss to each position
A pinescript v4 label will appear for each new signal displaying the ATR*multiplier value at signal time
All the BEST
Dave

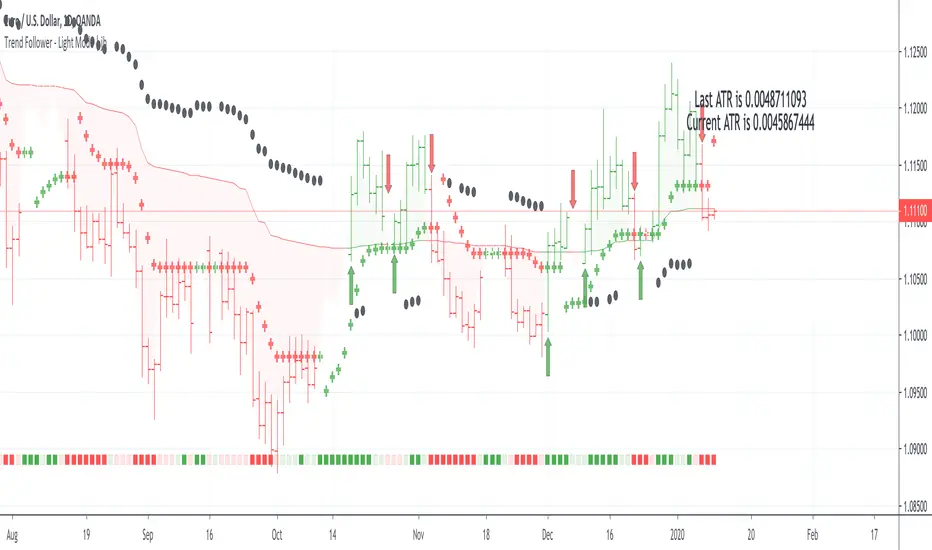
Trend Follower - Light Mode | jhFollow up script for my Trend Follower script.
I'm used to dark mode, so I coded a few key plots in white, so those are changed into black on the script.
Notably:
- > 1 ATR in black dots along the baseline
- Current and previous ATR text labels to the right of the price
- A text label spacing input that allows you to adjust the spacing for text label from price.
This is a trend following system that combines 3 indicators which provide different functionalities, also a concept conceived by VP's No Nonsense FX / NNFX method.
1. Baseline
The main baseline filter is an indicator called Modular Filter created by Alex Grover
- www.tradingview.com
- Alex Grover - Modular Filter
-------
That's the moving average like baseline following price, filtering long and short trends and providing entry signals when the price crosses the baseline.
Entry signal indicated with arrows.
2. Volume/Volatility, I will called it Trend Strength
The next indicator is commonly known as ASH, Absolute Strength Histogram.
This indicator was shared by VP as a two line cross trend confirmation indicator, however I discovered an interesting property when I modified the calculation of the histogram.
- Alex Grover Absolute Strength
-------
My modification and other info here
- Absolute Strength Histogram v2
-------
I simplified the display of the trend strength by plotting squares at the bottom of the chart.
- Lighted Squares shows strength
- Dimmed Squares shows weakness
3. Second Confirmation / Exits / Trailing Stop
Finally the last indicator is my usage of QQE (Qualitative Quantitative Estimation), demonstrated in my QQE Trailing Line Indicator
- QQE Trailing Line for Trailing Stop
-------
Three usages of this amazing indicator, serving as :
- Second trend confirmation
- Exit signal when price crosses the trailing line
- Trailing stop when you scaled out the second trade
This indicator is plotted with crosses.
Additional plots and information
Bar Color
- Green for longs, Red for shorts, White when the baseline direction conflicts with the QQE trailing line direction
- When it's white, it's usually ranging and not trending, ASH will also keep you off ranging periods.
-------
ATR Filter
- White circles along the baseline, they will show up if the price has moved more than one ATR from the baseline
- The default allowance is 1 ATR.
-------
The previous and current ATR value
- Label on the right side of the chart showing the previous and current value of ATR
Trend Follower | jhThis is a trend following system that combines 3 indicators which provide different functionalities, also a concept conceived by VP's No Nonsense FX / NNFX method.
1. Baseline
The main baseline filter is an indicator called Modular Filter created by Alex Grover
- www.tradingview.com
- Alex Grover - Modular Filter
-------
That's the moving average like baseline following price, filtering long and short trends and providing entry signals when the price crosses the baseline.
Entry signal indicated with arrows.
2. Volume/Volatility, I will called it Trend Strength
The next indicator is commonly known as ASH, Absolute Strength Histogram.
This indicator was shared by VP as a two line cross trend confirmation indicator, however I discovered an interesting property when I modified the calculation of the histogram.
- Alex Grover Absolute Strength
-------
My modification and other info here
- Absolute Strength Histogram v2
-------
I simplified the display of the trend strength by plotting squares at the bottom of the chart.
- Lighted Squares shows strength
- Dimmed Squares shows weakness
3. Second Confirmation / Exits / Trailing Stop
Finally the last indicator is my usage of QQE (Qualitative Quantitative Estimation), demonstrated in my QQE Trailing Line Indicator
- QQE Trailing Line for Trailing Stop
-------
Three usages of this amazing indicator, serving as :
- Second trend confirmation
- Exit signal when price crosses the trailing line
- Trailing stop when you scaled out the second trade
This indicator is plotted with crosses.
Additional plots and information
Bar Color
- Green for longs, Red for shorts, White when the baseline direction conflicts with the QQE trailing line direction
- When it's white, it's usually ranging and not trending, ASH will also keep you off ranging periods.
-------
ATR Filter
- White circles along the baseline, they will show up if the price has moved more than one ATR from the baseline
- The default allowance is 1 ATR.
-------
The previous and current ATR value
- Label on the right side of the chart showing the previous and current value of ATR
Adding my Didi and ASH indicators up on this screenshot
Didi Index Improved with QQE

BEST Trailing Take Profit StrategyHello traders
Hope you enjoyed your weekend on my behalf. Was staying home working ... ^^
This is my first strategy educational post I'm doing ever
While I'm generally against posting strategies because it's very easy to fake performance numbers... I cannot prevent myself from sharing a few cool strategy snippets anyway.
So from now on, I'll be sharing a few strategies also - generally not to showcase performance but only to show what pinescript can do.
As once again strategy performance can be faked is so many ways... :)
What's on the menu?
We all know what a trailing-stop is. right? right? Ok... sharing the definition here :)
A trailing stop is designed to protect gains by enabling a trade to remain open and continue to profit as long as the price is moving in the investor's favor. The order closes the trade if the price changes direction by a specified percentage or dollar amount.
But...do you know what a trailing profit is?
Short definition : Well the same but with your profit limit order.
Long definition : A trailing profit is designed to increase your gains by enabling a trade to remain open and continue to profit as long as the price is moving in the investor's favor. The order closes the trade if the price hits the trailing profit level specified percentage or dollar amount.
Some trading strategies used both a trailing stop AND trailing profit. Not making any recommendation here - only sharing what's possible in the realm of trading and pinescripting
Trigger me I'm famous
I developed many trading strategies in my career and often I've been asked to trigger a trailing-stop or trailing-profit once a certain % move has been made.
I integrated here a Take Profit trigger - once hit, it will activate the trailing profit
On the screenshot below, the TP trigger is plotted in orange. Once the price goes past that level for the first time, I'll start trailing the profit level.
In other words, when we see a price makes an interesting move in percentage value - we decide to offset the profit as we concluded that once it reached such distance - then it leads often to more profit
Of course, using only a trailing profit without stop/trailing-stop/invalidation isn't smart and the surest way to kiss goodbye a trading capital and trading and your good mood
See you tomorrow for another strategy snippet
All the BEST
Dave

Blackman Filter - The Smoother The BetterIntroduction
Who doesn't like smooth things? I'd like a smooth market price for christmas! But i can't get it, instead its so noisy...so you apply a filter to smooth it, such filters are called low-pass filters, they smooth and its great but they have lag, so nobody really use them, but they are pretty to look at.
Its on a childish note that i will introduce this indicator, so what it is all about? I propose a new FIR filter using a blackman function as filter kernel for financial time-series smoothing, do you prefer the childish tone ? Fear not its surprisingly easy!
The Blackman Function
The blackman function look like a bell shaped curve, look:
The blackman function will produce such curve. This function is called a cosine sum function because she is based on the sum of cosine functions, here only 2.
0.42 - 0.5 * cos(2 * pi * k) + 0.08 * cos(4 * pi * k)
Originally you use this function for windowing , what does it means? In signal processing you have a function called sync function , if you use this function as filter kernel you would get the ideal frequency domain response filter, sometime called brickwall filter, it would be extremely smooth.
Above the optimal low pass filter frequency response.
However the sync function has no ending values and goes on forever, therefore we can't use it for convolution, expect if we apply windowing. Filters using windowing are called windowed-sinc filters, i will describe the procedure below :
1 - Create a sync function = sin(pi*n)/(pi*n)
2 - Truncate it = I only keep the first length points of the sync function.
This create a abrupt end, the frequency of a filter using step 1 as kernel would contain ripples in the pass band and stop band, this is bad! The frequency response would look like this :
3 - I multiply my values of step 2 by a window function, it can the blackman window, i no longer have an abrupt end, its smooth!
The frequency response of the filter using this kernel would no longer have ripples! This is the power of windowing functions.
Here we are not using such thing, but we could in the future. Here instead we use the blackman function as filter kernel, because this function is bell shaped this mean that the filter will certainly be smooth (symmetrical weighting is a rule of thumb for kernels when we want really smooth filters).
The Filter
This filter is quite smooth, unlike the gaussian filter this filter give less weights to recent and past values, this is because the blackman function has fatter tails than the gaussian one. I could make a comparison of both, however they are quite alike, if you often use a gaussian filter its up to you to decide which one you prefer.
The filter can do a better job than the moving average when it comes to preserve the frequency components that constitute the cycles/trend.
We can see that the filter has a greater performance when it comes to keep the shape of the market price, thus it has a slightly better fit.
Conclusion
Ok so in this post you learned a bit about the sync function and windowing, those are basic subjects in signal processing, they allow us to approximate the filter with the ideal frequency response, i also showed you that those windowing function could be used as kernel and that they where pretty smooth on their own, there are many others, but the one i prefer is the blackman windowing function.
I know what you are thinking, "we want trailing stops, alerts, colors, arrows!", and i understand you pal, but sometimes its cool to take a break from all this stuff. However i can tell that i'am working on a side project that aim to estimate rolling maximum/minimum as fast as possible, any experiments will be published here, and i can ensure you that those indicators will make your day quite brighter, we will see that soon.
I hope you learned something from this post! I'am a bit tired (look i'am disappearing !)
Thanks for reading !

Bollinger Band Strategy (Basic) Version 1 This strategy is for learning purposes only. Pay special attention to these strategies on longer aggregation periods (like 1 hr chart or more). Don't expect accurate results when you set a limit to 10 cents above your entry to be accurate. For example if you set the chart to 1 day, the price may move down and hit a stop 10 times then tag your limit. If this doesn't make sense, just don't use strategies here. Learn more first. That being said, I don't have specific recommendations for each aggregation period, backtesting isn't always perfect.
Now then, this strategy can be used as the traditional BB method by setting the "Stop" and "Limit Out" to like 10000, check "Reversal Entry" and uncheck "Limit Time of Day" This will keep the strategy running just reverse your position when price crosses outside each band.
INPUTS:
Length - length of WMA that I used for mean of Bollinger Band (this may suppose to be SMA, too bad)
Source - O-H-L-C basis for WMA
Deviation - normal Standard deviation that would be set when using Bollinger Band
Trailing stop check box - your stop value will be either a hard stop or trailing stop for an exit
Stop - the stop value - remember you can set this really high and it won't stop out
Limit Out - the limit value for exit
Reversal Entry check box - This changes each entry from a reversal (traditional idea of BB) to enter a trend trade - hopefully version 2 will have choice to trend one direction and reversal in the other.
Limit Time of Day - Especially when trading futures, you may want to only trade a specific time of day, when this box is checked, you can set the entry times below, exit will still only occur based on limit/stop or a flip entry order (the opposite entry condition is met)
Tips:
when I don't know a thing about a price range, like gold. I can set the limit out to 10000 and play with a trailing stop to get a better idea of what is even possible before tuning further.

ATR ChannelsATR Channels help you to identify where to place your stop-loss or trailing stop-loss based on price volatility, according to the Average True Range (ATR).

RePaNoCHa V4 [Alerts]Script for automatic trading with Alerts.
LG --> Long (green: not confirmed) (lime: confirmed)
ST --> Short (maroon: not confirmed) (red: confirmed)
TS --> Trailing Stop
xL --> Close Long Position
xS --> Close Short Position
SL --> Stop Loss
The trailing stop closes the trade if the price changes direction by a specified percentage or offset. There is no ideal distance because markets and price are always changing and we know that is impossible to exit on the top or bottom. This script interpolate the trailing Stop Offset with profit, higher profit --> higher Trailing Stop Offset. Despite this, it's difficult to catch the price but not impossible. It has a TS delay too. It take a snapshot every X seconds, if the TS is activated the alert is triggered, otherwise the price keeps fluctuating until a new snapshot.
It can be easily converted to Backtest. Just delete "//" on the corresponding part.
Default settings for XBT:USD at 1H.

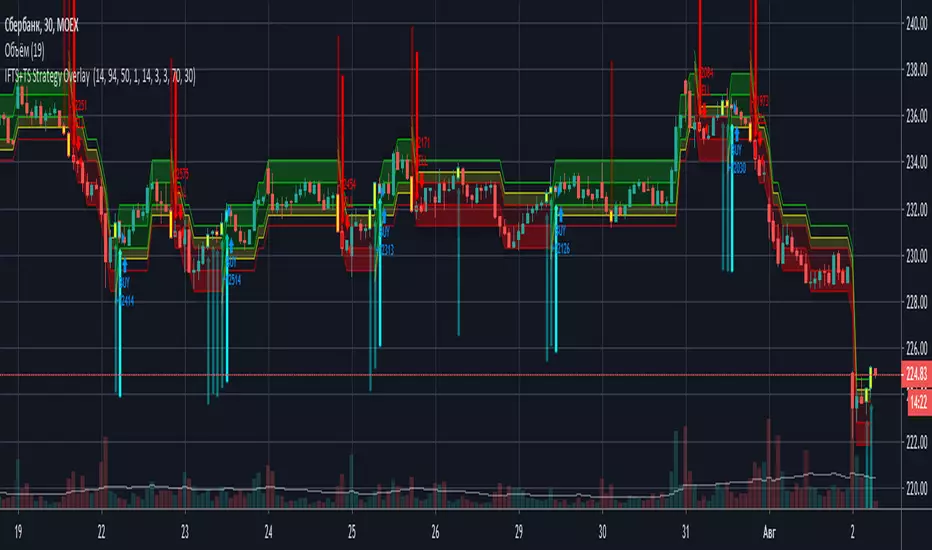
IFTS+TS Strategy OverlayInverse Fisher transform on stochastic with Hull MA and Donchian Channels with oversell/overbuy levels and dynamic trailing stop
Options:
Fixed trailing stop
Dynamic, based on ATR trailing stop
Re-enter after trailing stop
Includes Hull MA
Hull MA filtration for re-entering after trailing stop
Donchian channels, with overbuy/oversell levels
No repaints
Dragon-Bot - Default ScriptDragon-Script is a framework to make it as easy as possible to test your own strategies and set alerts for external execution bots. This is the alerts version of the script.
The script has many features build in, like:
1) A ping/pong mechanism between longs and shorts
2) A stop-loss
3) Trailing Stops with several ways to calculate them.
4) 2 different ways to flip from long to short.
The script is divided into several parts.
The first part of the script is used to set all the variables. You should normally never change the first part except for the comments at the top.
The second part of the script is the part where you initialise all your indicators. Several indicators can be found on Tradingview and on other sites. Please keep in mind that all the variable names used in the indicator should be unique. (all the … = … parts)
The third part of the script, is the most important part of the script. Here you can create the entry and exit points.
Let’s look at the OPENLONG function to explain this part: The first variables are all the possible entries; These are longentry1 till longentry5. You can add many more if you like.
The variables are all initialised as being false. This way the script can set a value to true if an entry happens.
The if function is the actual logic: You could say “if this is true” then (the line below the if function) longentry1 := (becomes) true.
In this case we have said: “if this is true” then (the line below the if function) longentry1 := (becomes) true when the current close is larger than the close that is 1 back.
The last part is the makelong_funct. This part says that if any of the entries are true, the whole function is true.
The last part of the script is the actual execution. Here the alerts are plotted and the back test strategies are opened and closed.
We hope you guys like it and all feedback is welcome!

Dragon Bot - Default ScriptDragon Script is a framework to make it as easy as possible to test your own strategies and set alerts for external execution bots.
The script has many features build in, like:
1) A ping/pong mechanism between longs and shorts
2) A stop-loss
3) Trailing Stops with several ways to calculate them.
4) 2 different ways to flip from long to short.
The script is divided into several parts.
The first part of the script is used to set all the variables. You should normally never change the first part except for the comments at the top.
The second part of the script is the part where you initialise all your indicators. Several indicators can be found on Tradingview and on other sites. Please keep in mind that all the variable names used in the indicator should be unique. (all the … = … parts)
The third part of the script, is the most important part of the script. Here you can create the entry and exit points.
Let’s look at the OPENLONG function to explain this part: The first variables are all the possible entries; These are longentry1 till longentry5. You can add many more if you like.
The variables are all initialised as being false. This way the script can set a value to true if an entry happens.
The if function is the actual logic: You could say “if this is true” then (the line below the if function) longentry1 := (becomes) true.
In this case we have said: “if this is true” then (the line below the if function) longentry1 := (becomes) true when the current close is larger than the close that is 1 back.
The last part is the makelong_funct. This part says that if any of the entries are true, the whole function is true.
The last part of the script is the actual execution. Here the alerts are plotted and the back test strategies are opened and closed.
We hope you guys like it and all feedback is welcome!

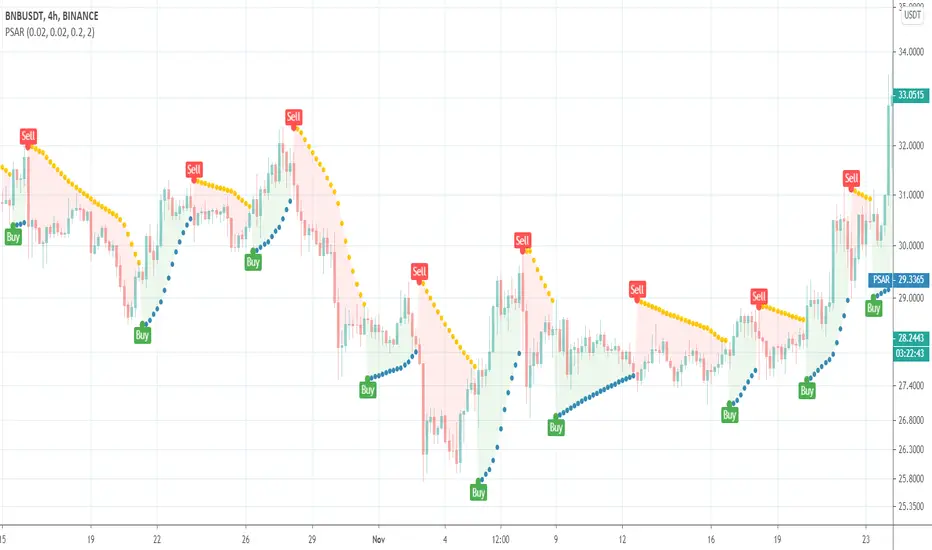
Parabolic SARThis is a redesign of the built-in Parabolic SAR indicator. I added a proper input system, an option to highlight initial points for both lines and an option to choose points width. So, customize it as you want.
Parabolic SAR was originally developed by J. Welles Wilder and described in his book "New Concepts in Technical Trading Systems" (1978). It is a trend-following indicator that can be used as a trailing stop loss.
To know which settings for PSAR are the most profitable on your instrument and timeframe you can use this tool
Profitable Parabolic SAR
MTA-Traling StopIntroduction
Based on my previous indicator , this indicator plot a trailing stop using classic conditions.
Using The Indicator
Like any trailing stop when price is higher than the trailing stop this imply a buy signals, when price is lower than the trailing stop this imply a sell signal. It is possible to use decimals instead of integers for length as shown here :
length = 14.7
The indicator tend to react faster to price movements when a trend has been really long, this methodology is similar to the one used by the parabolic sar.
Downsides
Lack of robustness with the length parameter, the behaviour of the trailing stop can be hard to predict. There is a real need for control.
Conclusion
The indicator can be adaptive, even if it already is in a certain way, by changing the alpha variable at the start considering that 0 < alpha < 1. Its not recommended to use it right now except for testing/coding purpose.
It is clear that i'm not enthusiast when it come to this script, there is a real lack of accuracy, i still hope it can be of use.

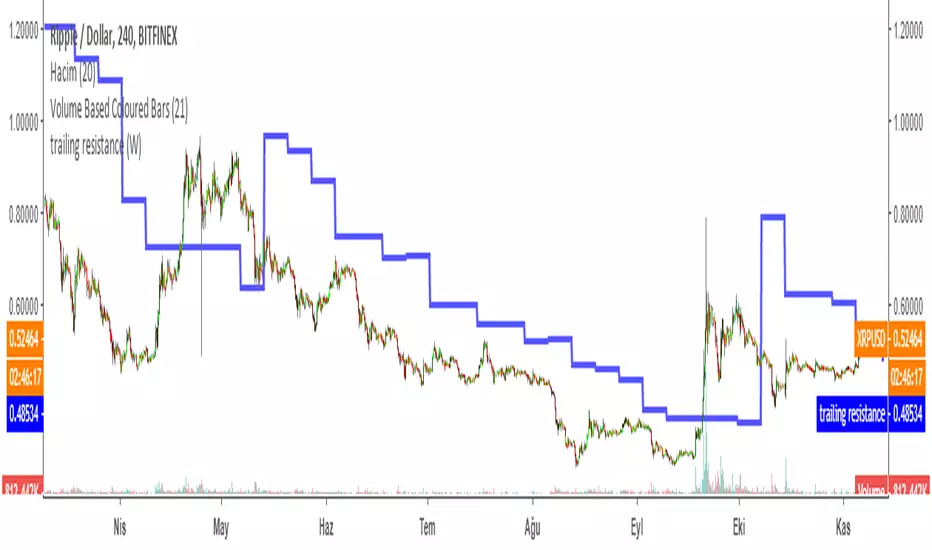
Trailing Resistance MTFTRAILING RESISTANCE INDICATOR is a helpful tool for traders to help one of the common problems that they face: where to buy/sell?
by using trailing resistance you can easily decide and see possible upward movements and understand if you are in a safe zone.
Using Trailing Resistance is just simple:
Go long/ Buy when price crosses above the indicator,
Stay on short position if prices are below the indicator.
The indicator is calculated from previous Lows and doesn't the value won't change until prices makes higher lows.
Multiple Time Frame Version of Trailing Stop Loss Indicator
Trailing Stop Loss Indicator by KıvanÇ fr3762
TRAILING STOP LOSS INDICATOR is a helpful tool for traders to help one of the greatest problems that they face: where to sell?
by using trailing stop loss you can easily decide and see possible downward movements and understand if you are in a safe zone.
Using Trailing Stop Loss is just simple:
Go short/ Sell when price crosses down the indicator,
Stay on long position if prices are above the indicator.
The indicator is calculated from previous Lows and doesn't the value won't change until prices makes higher lows.
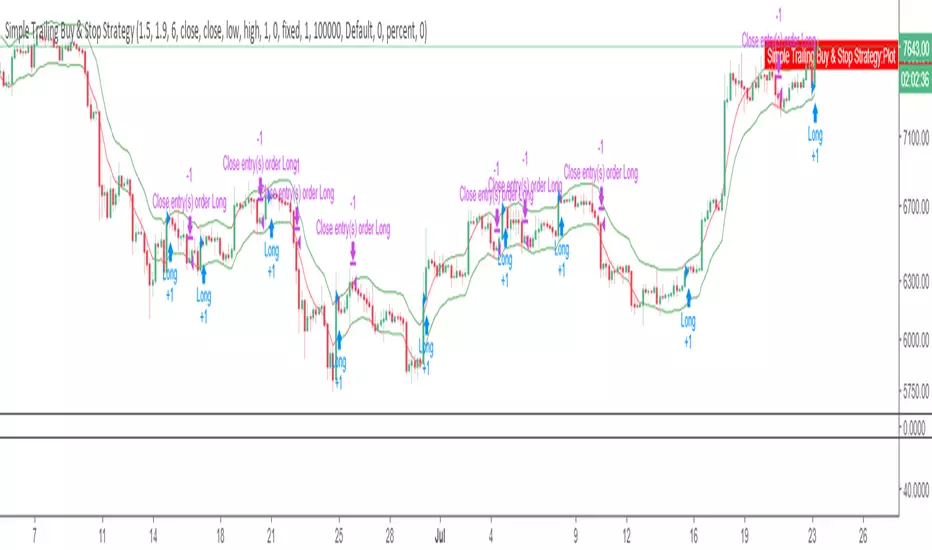
Simple Trailing Buy & Stop StrategyAllows you to backtest a simple percentage based trailing stop, with a trailing buy. Experiment with different percentages on different timeframes for different charts.
For BTCUSD, on daily 4.3% stop and 1.9% buy works well, while on 4hr a 1.5% stop and 1.9% buy works best.
Please comment with any other combos that work well for you on different markets or timeframes.
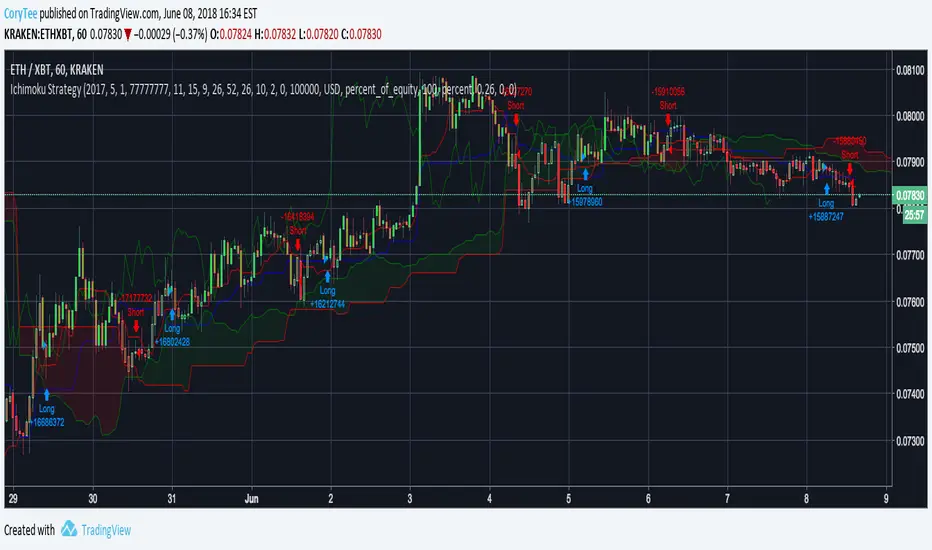
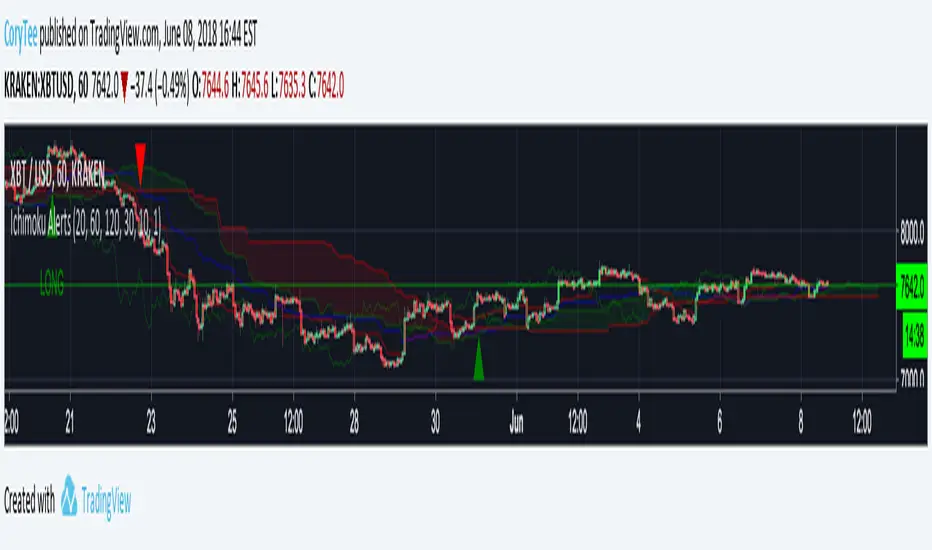
CoryT's Noro's Ichimoku AlertsA few months ago I took Noro's Ichimoku Cloud and used the AV bot template to throw stops on it. I took some code from JustUncleL
to make it not so hideous. Trailing Stops are turned off, stop losses are turned off (you really don't need them with this), and this is currently a Long/Short strategy, the Longs Only and Shorts Only options are broken right now, I'm tired and you guys can either fix it yourselves or deal with it like this for now.
Hint: If you wanna use this as a long-only strategy just have AV close your buy orders whenever a short is triggered.
CoryT's Noro's IchimokuA few months ago I took Noro's Ichimoku Cloud and used the AV bot template to throw stops on it. I took some code from JustUncleL
to make it not so hideous. Trailing Stops are turned off, stop losses are turned off (you really don't need them with this), and this is currently a Long/Short strategy, the Longs Only and Shorts Only options are broken right now, I'm tired and you guys can either fix it yourselves or deal with it like this for now.
Hint: If you wanna use this as a long-only strategy just have AV close your buy orders whenever a short is triggered.